 Join our Telegram group now to get live updates about Nifty and BankNifty BN Option Chain Analysis and more!
![]() Join our WhatsApp group now to get live updates about Nifty and BankNifty BN Option Chain Analysis and more!
Join our WhatsApp group now to get live updates about Nifty and BankNifty BN Option Chain Analysis and more!
We have been updating the both Nifty and BankNifty Option Chain Analysis table on a daily-basis. Our telegram channel provides live updates on this every 5/10 minutes.
Here’s a post on what it is and how it can be leveraged at the start of the day and during the course of the day.
Consider the following screenshot of NIFTY option chain taken on 15th July 2022 (around 11 AM). 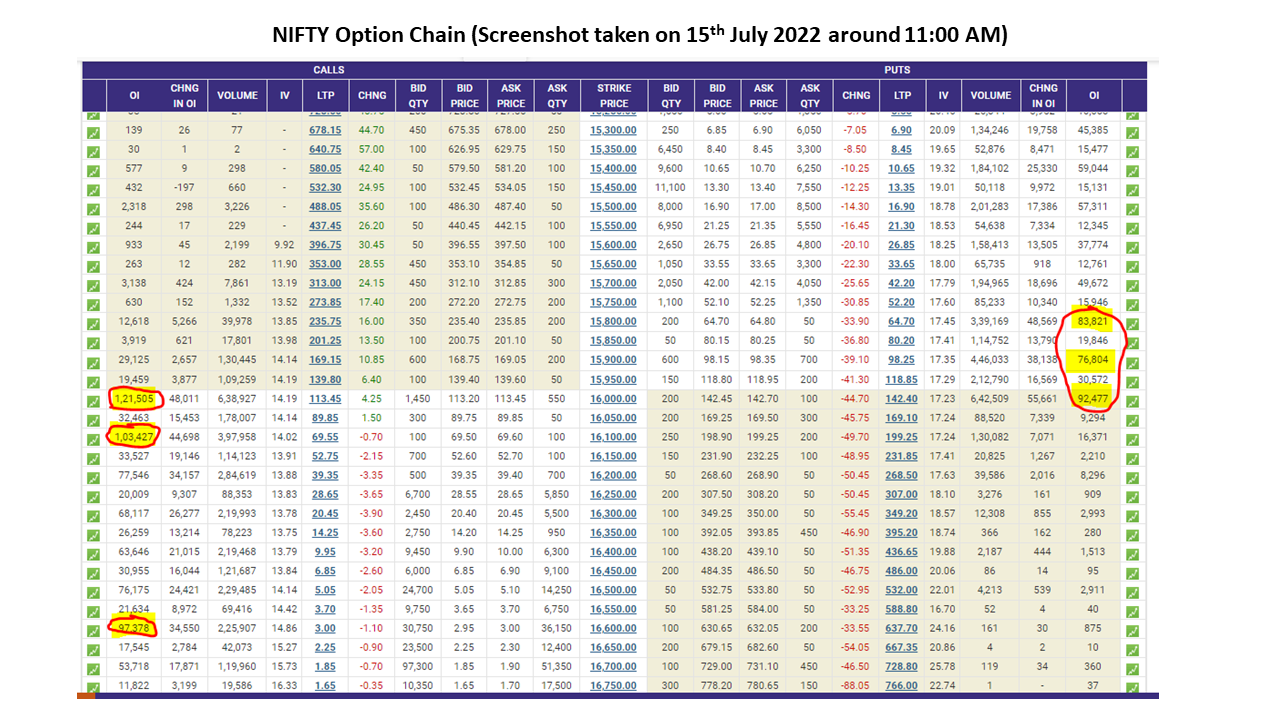
There is a ‘concentration’ of sellers at around 15800, 15900 and 16000 levels on the PUT side, and 16000, 16100, 16600 levels on the CALL side. Concentration refers to just more number of sellers.
Below is a screenshot of the telegram channel live-update —
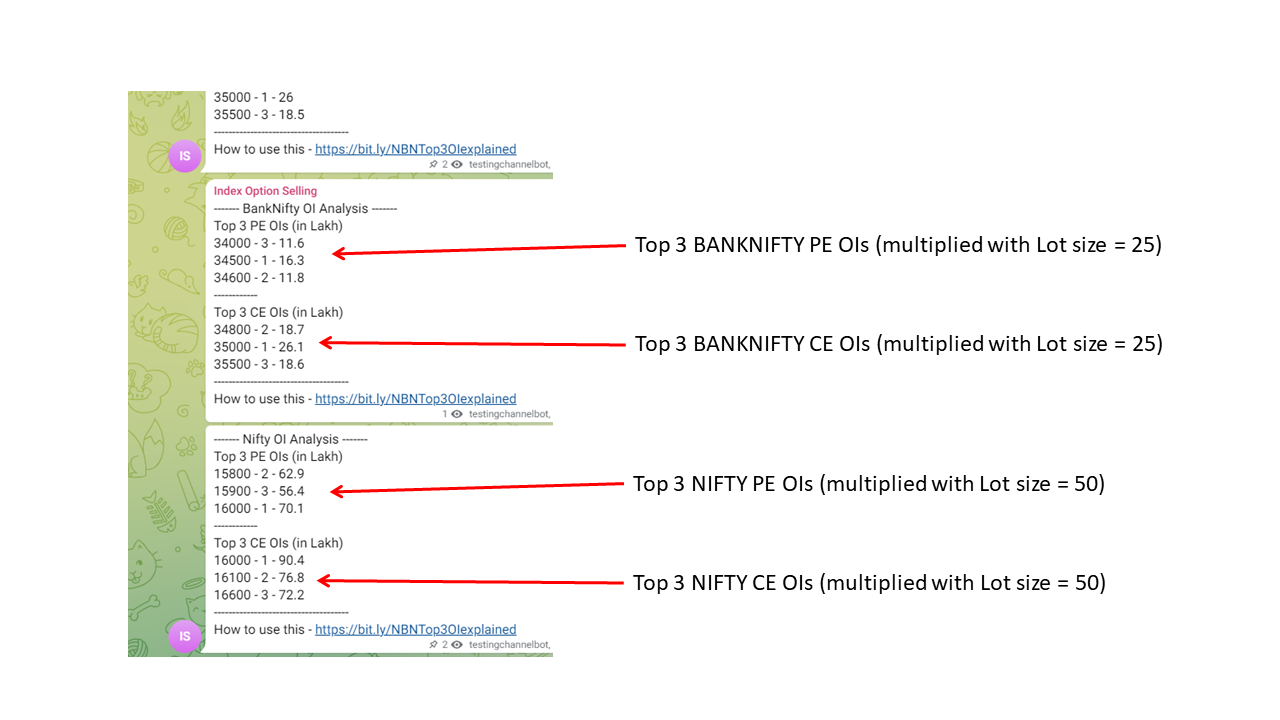
How can we use this information –
- We know that CE sellers do not want to the markets to move upwards, and PE sellers do not want markets go down either.
- So there is a constant tug-of-war between the sellers on both sides.
- We can leverage this information by selling options on both CE and PE sides (Short Strangles)
A more detailed explanation on how things span out is shown below
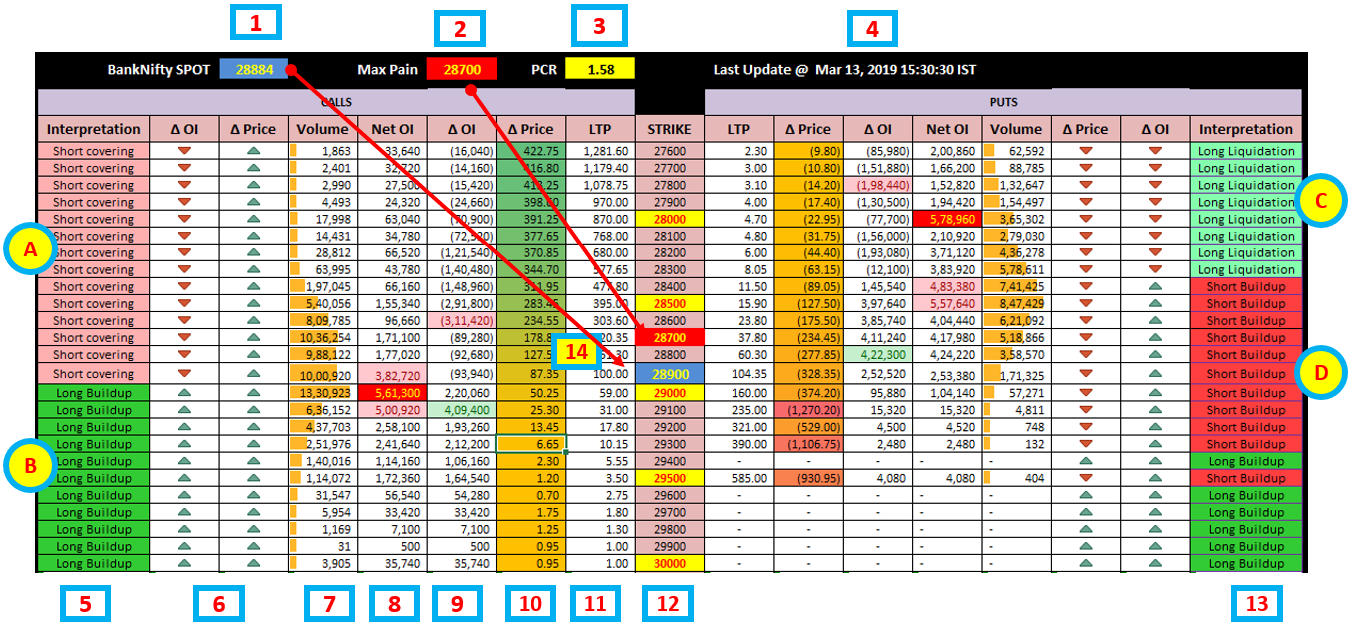
Here’s a sample image generated at the end of day, 13th March 2019 (The previous day’s close was at 29448. Banknifty closed at 28884 with a rally of close to 450+ points)
Explanation –
1 – Banknifty BN SPOT value at the end of the day (here 13th March 2019)
2 – Max Pain is at 28700. In short, it means, BN has to move closer to 28700 else writers will burn money/ bleed more/ lose money. So it is assumed that they would take appropriate action to reverse the market to the max pain levels
3 – PCR – Put-Call ratio – as the name suggests, it is the Ratio of Total PUT OI and the Total Call OI. It is seen with a contrarian view – Generally, a PCR value of over 1.3 is considered bearish, and a PCR value of less than 0.5 is considered bullish
4 – Timestamp when the table was generated/refreshed
5 – Interpretation on the CE options side (Kindly check below, this has been explained separately)
6 – Delta OI and Delta Price – Just a symbolic representation, these arrows – Up and Down – represent change in OI and price.
7 – Volume refers to the total trades executed – when there is a buy and corresponding sell, the volume goes up by 1
8 – Net OI – The total number of written options at a particular level. It can be seen that 5.6 lakh OI is at 29000 CE level, 5 lakh at 29100 CE level, 3.8 lakh at 28900 CE level (These 3 levels have been highlighted). The CE writers dont want the Banknifty value to go up. Hence these 3 levels form a great resistance.
9 – Change in OI – OI which got added or removed on 13th March. We have highlighted the highest positve change (4 lakh at 29100 CE) and the highest negative change (-3.11 lakh at 28600). This means CE writers have written more 29100 CEs today and they believe BN wont move above 29100. Also, 28600 CE writers have closed their positions owing to losses.
10 – Change in Price from previous day’s close
11 – LTP – Last Traded Price of a particular option
12 – Strike – Strike price of the option
13 – Interpretation on the PE options side (Kindly check below, this has been explained separately)
14 – Multiples of 500 have been highlighted in Yellow as they form intermediate supports and resistances. The Max Pain value has been highlighted in Red. A strike closer to the current SPOT value has been highlighted in Blue.
A similar explanation can be give for the PE side.
Range
From Column 8 – Max Net OI on the CALL side is at 29000. Max Net OI on the PUT side is at 28000. Hence the probable range is 28000-29000.
Interpretation (A, B, C, D)
A – Short Covering (Fear of Loss) – CE writers have been bleeding/ losing money, and hence they have covered their shorts/ squared off their CE shorts/ closed positions to prevent further losses
B – Long Buildup (Expecting Profits) – CE buyers have taken postions expecting BN spot to go further up.
A represents closing positions to prevent further losses, while B represents expectation of the BN spot to move up.
C – Long Liquidation (Happy, Book profits, Greed) – PE writers are happy that the spot has moved in their favour. They have booked profits and possibly rolled up to the next higher PE levels. The delta OI till 28300 is negative (PE writers have closed positions) and probably moved to levels 28400 PE and above.
D – Short Buildup (in continuation to C, Expecting trend to continue) – PE writers have written fresh postions across 28400 PE to 29300 PE expecting BN spot to move further up in their favour
You can find the daily posts on Nifty and Banknifty option chain analysis here.
Join our Telegram group now to get live updates about Nifty and BankNifty BN Option Chain Analysis and more!
![]() Join our WhatsApp group now to get live updates about Nifty and BankNifty BN Option Chain Analysis and more!
Join our WhatsApp group now to get live updates about Nifty and BankNifty BN Option Chain Analysis and more!
Learn option trading and start earning a passive income!
Please post your comments/ feedback in the section below. Thanks.