I have been using (and improvising) this Bank Nifty option selling setup for at least 5 years now (mix of paper trades, excel back testing and real trades)
Assumptions/facts –
- SPOT is the only holy grail
- Indicators are just indicators, I don’t use them
- Open Interest shows where the actual money is being deployed/ taken out from the market
- The ‘big guys’ have more information than us, hence we have to follow them
- I don’t check VIX before entering a trade, but I do understand that one needs to sell when VIX is high. How high is high? 15.6 or 20 or 12?
- BankNifty is more volatile than Nifty. And multiples of 20 are far easier than multiples of 75, isn’t it? What is 13 X 20 and 13 X 75. Hence I chose BN
- Most of the option buyers lose money and hence selling options has an edge
If you agree on these points, please read on.
A statistical deep-dive:
I tried building this table using previous 20 years BN SPOT data. BN was trading around 10k if I remember it right and today approx 30300 today. I have normalized this data…
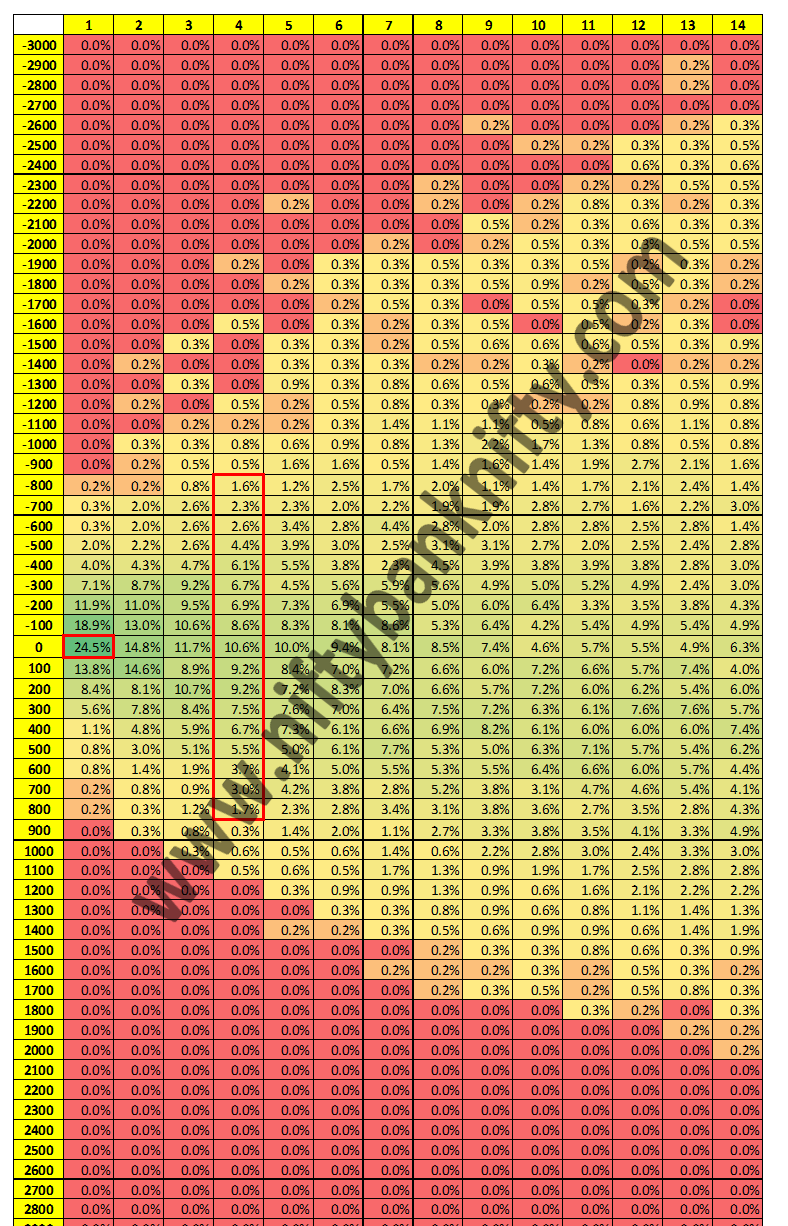
… and this is what I got

How to study this image – The row labels represent ‘n’ days from a particular day and column labels represent deviation in points.
Let us take 1 day on rows and 0 points on the columns. The value is 24.5%. It means – chances that BankNifty will move from 0 to 100 points from the current spot in 1 day is 24.5%.
If you need a larger range, simply add up the % values.
- Each column will add up to 100%
- It can be observed that the bottom half of the table has more greens than the upper half, indicating that the index moved up and up in the long run 🙂
How is this table useful –
Let us assume we are on Monday and the BankNifty Spot value is 27000. We have 4 days till expiry (weekly expiry). Considering the range to be (-800,800) from current spot (highlighted in red box), the values add up to 96.1%. So we can sell (27000 + 800) CE and (27000 – 800) PE, because these options will more likely (96.1%) expire as OTM options.
Further modifications/ improvements in this analysis –
- Exclude data points around planned major events and news (eg. Election results, RBI announcements etc.)
- Consider other metrics around normalizing the data
- Perform the same analysis with % values as the measure, or % change from the open price on any day. This can be used for intra-day option selling too
- Add in the element of Open Interest and Change in OI
Read more on Standard deviations, Short Straddle and Strangle returns, Option chain analysis
 Join our Telegram group now to get live updates about BankNifty BN Option Chain Analysis and more!
![]() Join our WhatsApp group now to get live updates about BankNifty BN Option Chain Analysis and more! Learn option trading and start earning a passive income.
Join our WhatsApp group now to get live updates about BankNifty BN Option Chain Analysis and more! Learn option trading and start earning a passive income.

Simple yet useful analysis
Thanks for sharing
Thanks a ton Rahul. You can go through the tag “research” and also – http://niftybanknifty.com/research/coming-soon/
Dear Raghu sir,
Can you please provide the above table in excel file ?
Have you prepared a similar table for nifty ? If yes, can you please provide ?
Thanks
Yes, we have provided here – http://niftybanknifty.com/nifty-range-using-standard-deviation/
Hey,
very helpful analysis this, thanks a lot!
Could you please let me know from where you got such a large set of historical data and do you by any chance happen to have the same data or analysis for nifty?
Hey Prashanth, We have data extracted from NSE website, other paid APIs. we have data for Nifty too. We will keep you posted soon.
Pingback: BankNifty BN Option Chain Analysis Strangle Straddle Returns Expected Movement 20th November 2020 – NiftyBankNifty.com
Pingback: WhatsApp group for sharing ideas – NiftyBankNifty.com
Pingback: BankNifty BN Option Chain Analysis Strangle Straddle Returns Expected Movement 27th November 2020 – NiftyBankNifty.com
Thanks. Provided information is helpful
Thanks your blog was so useful, all the best for your future progress.